Research on Remix and Cultural Analytics, Part 5
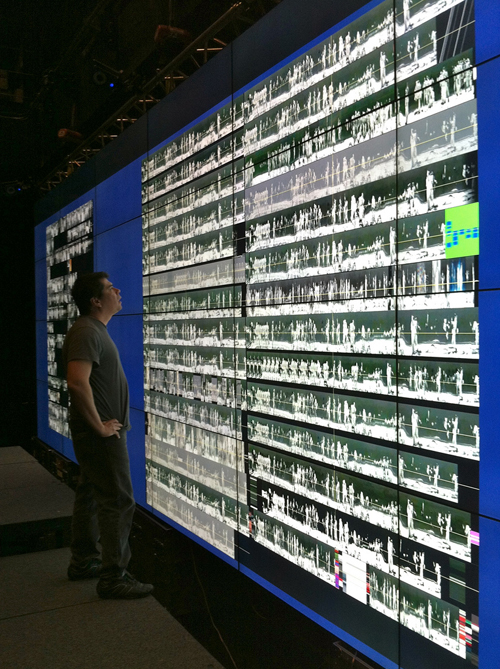
Image: evaluating sliced visualizations of The Charleston Style remixes at the Vroom at Calit2. View larger image. View other Vroom images by cultvis on Flickr.
In previous posts I discussed how I used cultural analytics to examine video mashups. (See part 1 on the Charleston Mix, part 2 on Radiohead’s Lotus Flower, and part 3 on the Downfall parodies, and part 4, on sliced visualizations of all three case studies.) One thing that is difficult in this process is to view all images at once in order to make the observations that I have discussed so far. This is when a large tiled screen is useful, such as the one available at the Vroom at Calit2, where the Software Studies Lab in San Diego is based. Below are images that give an idea of how the large screen is useful to evaluate various images at once.
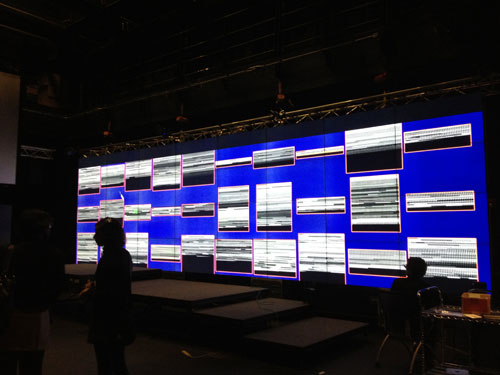
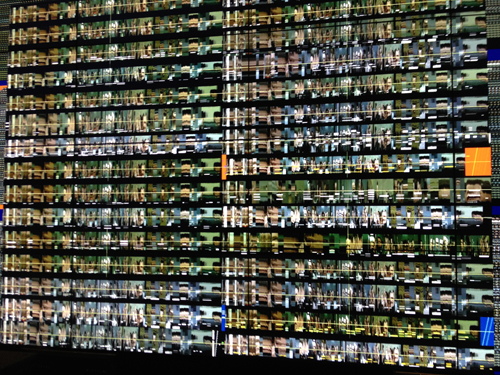
Image: wide view, 32 tiled-screen at the Vroom, Calit2. See larger image.
This image shows the thirty montage grid visualizations of my second case study, The Lotus Flower Parodies. The advantage in this case is that all thirty videos can be examined at once. This is something that is impossible on a regular laptop or a large computer screen. Being able to compare images in large scale is not only useful to come up with detailed analysis, but also provides the ability to discuss one’s research with other colleagues.
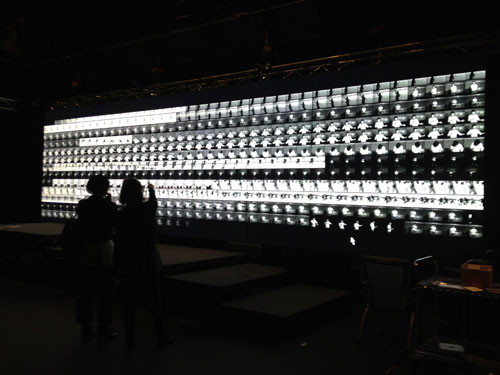
Image: Tracy Cornish, a researcher at CRCA, points out a detail to a colleague of my Lotus Flower remixes grid visualization. See larger image.
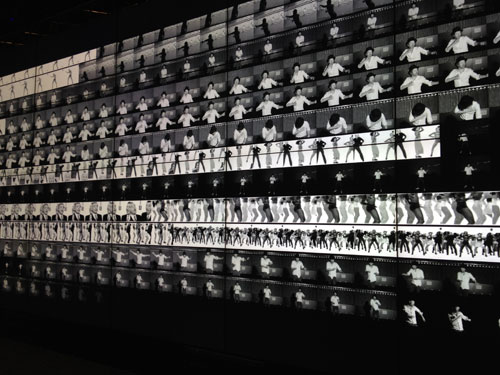
Image: Detailed visualization of Thom Yorke Does the Macarena! See larger image.
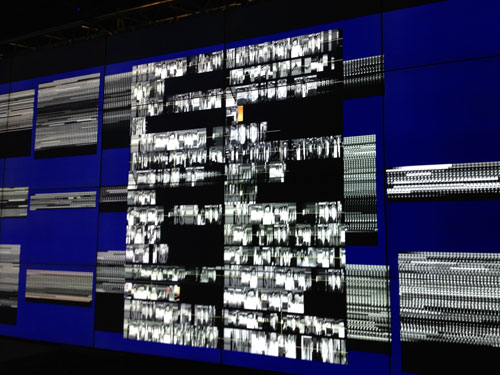
Image: Sliced images of Lotus Flower remixes on top of montage grid visualizations. (See part 3 and part 4 my analysis for more on sliced images.)
One of the advantages of the tiled screen, in addition to viewing many images at once and in great detail, is the fact that the files don’t appear inside windows as they would on an average computer. As the image above makes obvious, you can lay images next to each other, and on top of others, with no frame around them. While this feature might appear not so important when first considered, I found that it provided me with a sense of immediacy.
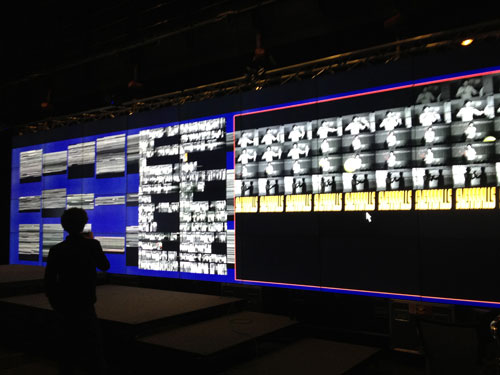
Image: Todd Margolis, Technical Director at CRCA, examines grid-montage and sliced image visualizations of Lotus Flower Parodies. See larger image.
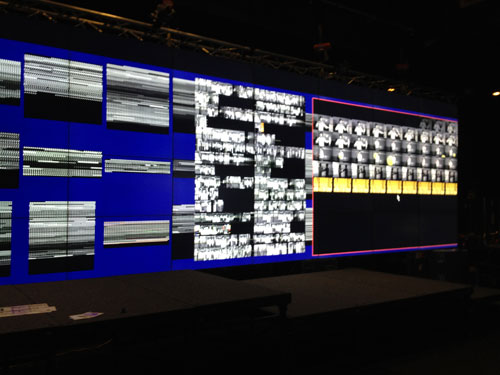
Image: alternate view of grid-montage and sliced image visualizations of Lotus Flower Parodies. See larger image.
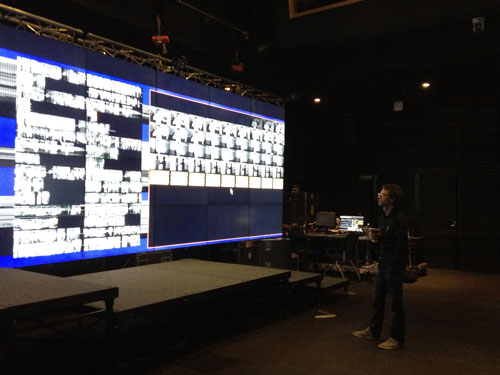
Image: Todd Margolis, Technical Director at CRCA, examines grid-montage and sliced image visualizations of Lotus Flower Parodies. See larger image.
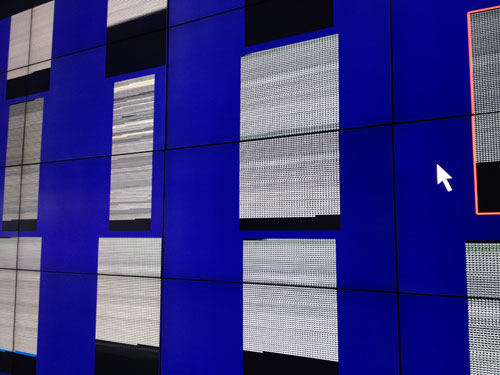
Image: detail of grid-montage visualization of Charleston Style remixes. See larger image.
Detail of sliced visualization of Downfall parodies. See larger image.
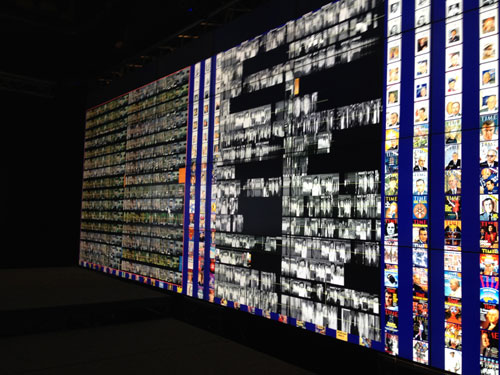
Image: sliced visuazlizations of the three case studies on top of Lev Manovich’s and Jeremy Douglass’s Time Magazine covers. See larger image.
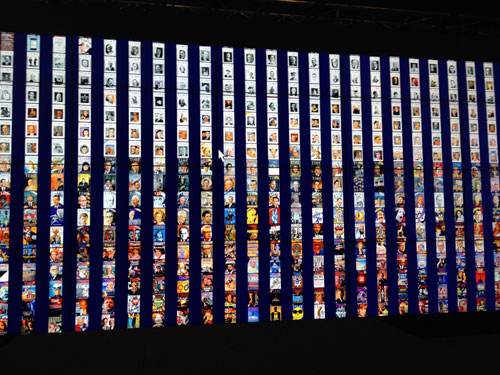
Image: detail of Lev Manovich’s and Jeremy Douglass’s Time Magazine covers. See larger image.
Going back to my initial point, when considering a large amount of images, such as all Time Magazine covers, it becomes evident how being able to view several images at once becomes an important part of visualization.
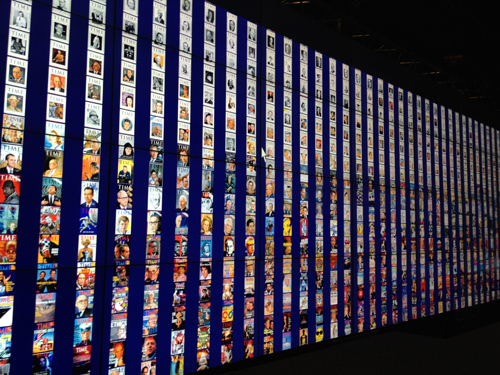
Image: alternate view of Lev Manovich’s and Jeremy Douglass’s Time Magazine covers. See larger image.